My Experiences with Home Solar Power
March 2013
Several years ago I seriously looked into installing enough photovoltaic solar panels on my house to become electrically independent. After doing a lot of research into the available systems and the financial demands involved, I postponed the effort.
I have recently resumed my interest and continued to study the currently available systems. I have discovered that although some of the various government and corporate incentives are less than they were earlier, the system prices have also dropped significantly and I feel that it makes economic sense now.
I Learn About Solar and Request Quotations
I have recently been getting more and more interested in again looking into solar electric panels for my home. I was coming home from shopping recently when I saw several signs for a "Solar Open House". With my ongoing interest in solar, I drove directly to the house address they listed, which was just around the corner from my house. There were trucks from a large company (which I later refer to as "Company A") with several workmen in the process of installing solar panels on the roof of the house. I spent some time talking to the homeowner, talking to the company salesman, reviewing literature, and examining the hardware they were installing as best as I could with yellow caution tape surrounding the house. I learned that the homeowner was hosting the open house to gain referrals for new systems, each of which earned her $400. I know she earned at least two of these bonuses. I made an appointment for several days later to have the salesman come and review my home. After seeing that the costs have dropped dramatically since I last pursued solar, I started a fairly extensive on-line research project, and requested two additional quotations. In contrast to the initial national company, these were from local companies, one located in the next town, and the other about an hour's drive from here. In the process of investigating the various types and configurations of current solar installations, I decided to put much of the knowledge that I gained by my research into a brief tutorial on solar systems. If you would like to read about these systems, please CLICK HERE FOR SOLAR TUTORIAL.
The solar panels will mount on south and east facing roofs in the back of my house. The exact configuration will be decided by the winning vendor along with my input.
I will continue to document the actual planning and installation of the system as it progresses.
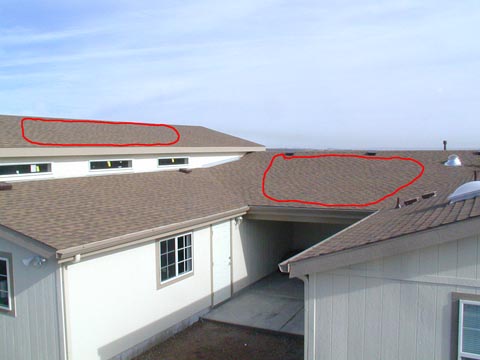
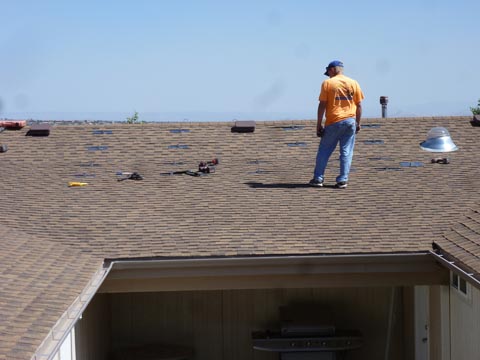
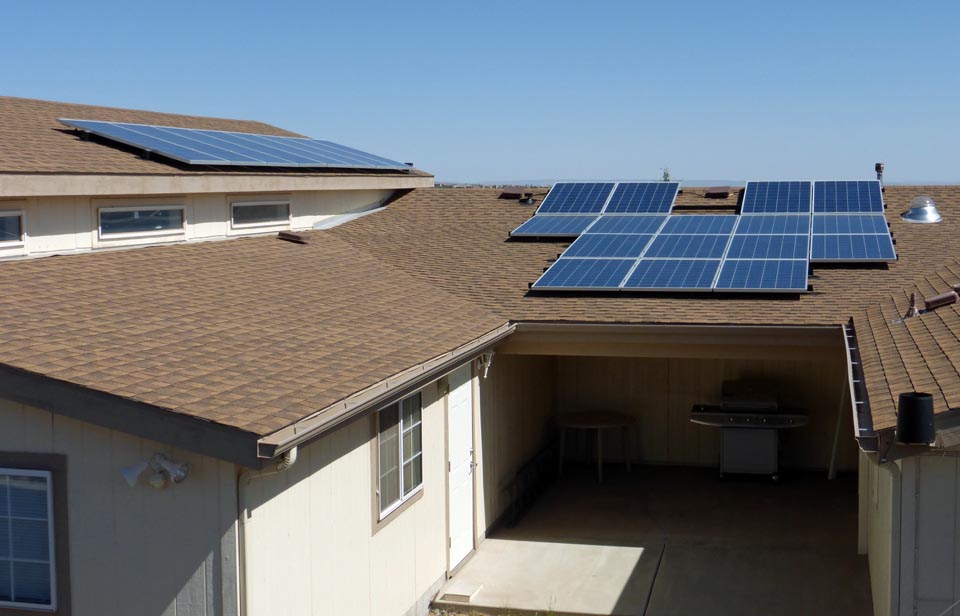
This view of my rooftop from the back shows where my panels will be mounted. Most will be mounted on the rear
roof of the garage (center) and the patio roof. The balance will mount on the eastern facing half of the motor home
garage roof (far left, highest) I was told by all three vendors that the minimum roof construction for mounting solar
was 2 x 6 trusses or rafters. Since manufactured homes don't use this construction, no panels can be mounted on
the house itself. All the added construction around my house qualifies.
My Quotes are In
As of Wednesday, March 20, 2013, I have received all three quotations I requested. In each case the company sent out a representative to inspect my house, checking things like the roof configuration, the location of my utilities, and my historical power usage. One rep took out his laptop and his battery operated printer and designed the system at my dining room table. The other two left with my information to generate the designs back at their offices. For this writeup I will just refer to the companies as Company A, Company B, and Company C.
To see the details of the three quotes (comparative, but no actual dollar figures), CLICK HERE FOR QUOTATIONS
Decision!
I decided I would be uncomfortable with the idea of a lease leaving me nothing at the lease end. Even if I am no longer around, it would still leave my kids with a problem. An owned system immediately would add about $20,000 to the value of my home (well over my net cost) and that should only drop slowly throughout its lifetime. The leased system would presumably start high, then decrease to around zero as the lease nears completion. It might even be negative shortly before the end. It could also seriously limit available buyers if I (or my heirs) were to try to sell my home. After coming to this conclusion, I ruled out Company A.
Comparing the systems Companies B and C proposed, and the associated costs, I eliminated Company C.
On 3/25/13, I signed a contract with Company B, who's real name is Pur Solar in Cottonwood, AZ, for an all American made micro-inverter solar system.
The purchased system from Pur Solar is a 5.88 kW, 24 panel AC system, and offers the lowest cost per watt after all incentives. The AC means the micro-inverter is factory incorporated into the solar panels and each panel produces AC "directly". Of course the panels still produce DC, but the incorporated micro-inverters change it to AC before reaching the output connector. The panels are made by Mage (pronounced ma'gay), a German company with a manufacturing plant and engineering force in Dublin, Georgia. The micro-inverters are by SolarBridge of Austin, Texas, and are incorporated into the panel at the Mage factory. The completed unit carries a 30 year warranty - the longest in the industry.
My electric bill should drop to about $9 $13 and I should generate 5 to 10% more electricity than I consume annually. In fact I should receive a small credit from the power company at the end of each year to apply toward future bills. Of course there will be months where I will use more than I generate and my bill will go up slightly. Other months I expect to generate a surplus to apply to the next overage. I will have to spend several years to receive all the incentives, but in the meantime I will pay no federal or state income taxes!
I have been approved for a loan from Credit Union West, against my Jeep, for more than enough to cover the delayed incentive payments, and I got a 2.49% interest rate! I think I am good to go!
If anyone reading this should decide to purchase a solar electric system within a reasonable distance of Cottonwood, AZ, I can recommend Pur Solar for the job. They offered reasonable pricing, excellent products, and high quality installation. If you do consider them, please give them my name (Dick Mason) as the person who referred you. They offer an incentive for obtaining new customers. Thanks.
April 2, 2013
Progress Begins
I received 2 drawings from the vendor to review. The first was an architectural drawing of my house showing the construction used in all the roof areas where panels were to be mounted. It shows the solar panel layout, their mounting details and gives the information the city will need to issue a permit. The second drawing was a total plot plan showing my full lot and the building and driveways on it, including the solar panels. The emphasis on this drawing was the location of utilities and the solar meter and disconnects and was prepared to submit to APS, our electric utility company.
I sent back a couple of minor changes. I hope this means the permit process will start shortly.
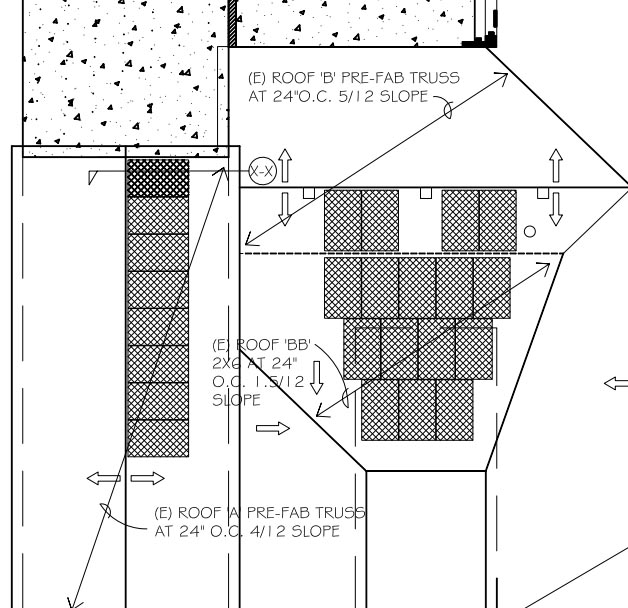
This is the panel arrangement the company has decided upon. Overall it looks like a very satisfactory arrangement.
We will make some minor adjustments at the time of installation, such as moving the 8 MH garage panels down
to leave a safe distance between the panels and the edge of the roof.
Tues, April 16
I just got word that my panels have shipped from the manufacturer and should be at my vendor's by April 22. He is planning to come out and start my installation on Tues, April 23 and should be done several days later.
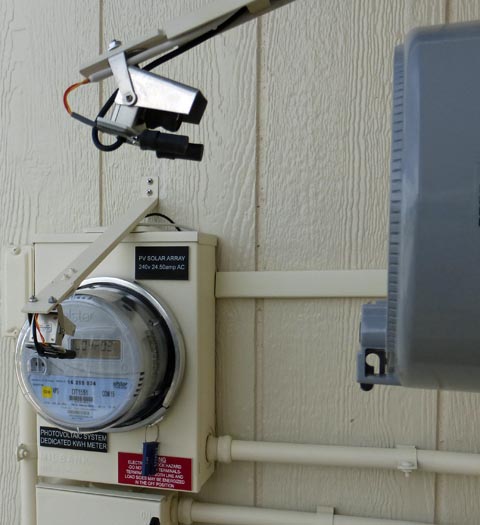
Monday, April 22 Pole-cam and Time Lapse Video
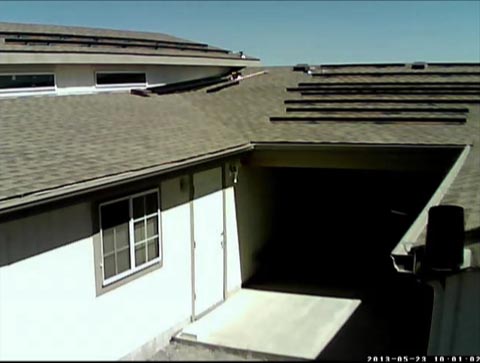
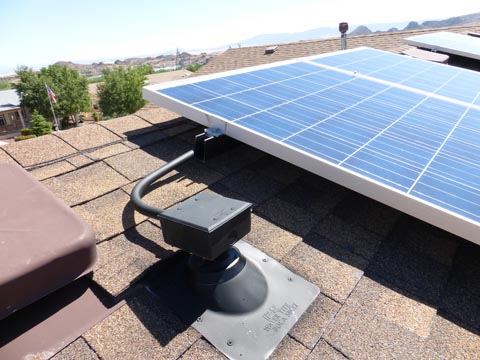
I have decided that I want to try recording a time lapse video of the solar installation. To that end, I have mounted a surveillance camera on a pole behind my house. The camera is a wireless IP camera which only needs wires for power. The video is transmitted to my network using WiFi, and can then be picked up and recorded on any of my computers. The view I am able to obtain is a little shy of fully covering the panel locations, but will only miss the very right and left edges. It's the best I can do with what I have. I felt the camera would be too vulnerable if I mounted it at the top of the bank, along the road, although that would have probably given me full coverage.
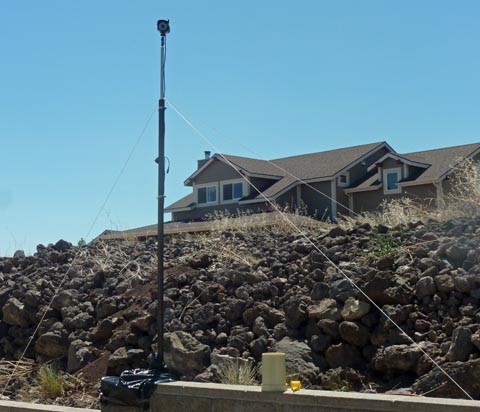
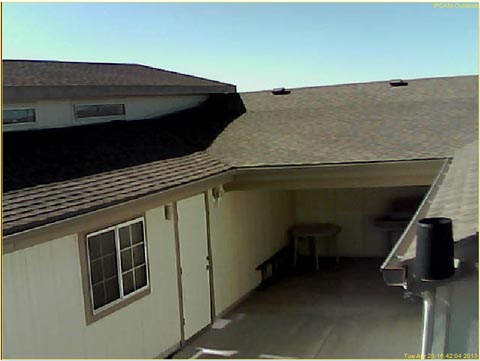
This is my camera as
set up behind my house, and the view from that camera. I
expect it will show most of the panel
surface area.
To see the resultant time lapse video, please go to the TIME LAPSE VIDEO SECTION near the end of this write-up.
surface area.
To see the resultant time lapse video, please go to the TIME LAPSE VIDEO SECTION near the end of this write-up.
The panels
should arrive at my
vendor's shop today, and the installer crew should be here to start
installing the system tomorrow!
Dissapointment! The City Strikes Again!
Tues, April 23
Oh well! The best laid plans . . .
I waited all day, making several calls with no replies and no installers. Finally I received an email from the company president stating he had been on a Hopi reservation since 3 AM with no cell coverage and just got home. He said the plan checker for the city of Prescott called and wants an engineer to sign off on the plans. We are using standard mounting techniques on a standard roof construction like thousands of previous installations, yet the city wants an engineer to approve it! Unbelievable! Who knows what that does to the schedule? The panels have truly been received and are now waiting in my contractor's warehouse for the permit to get straightened out. It will probably be at least a week delay.
Update of Tues, April 30
The engineer is supposed to have his calculations done by the middle of next week, about May 8. The plans then have to go back to the city for approval. It is looking like maybe the week of May 13 would be when they are ready, but I am on a motor home rally from the 13th to the 16th, so they will probably end up installing the week of the 20th.
PERMIT!
Update of Fri, May 17
OK, it was well over a week delay but as of yesterday late afternoon, WE HAVE A PERMIT!
I went over to Prescott Valley today to the Home Show which is running this weekend and met Travis, the president of Pur Solar. They have a booth there and are working all day today, Saturday, and Sunday. He will be here Tuesday afternoon, 5/21 to do the planning and coordinating with me, and to start the installation. He believes they will be through Friday and call for city inspection. Once the city signs off, they call APS for their inspection. When they sign off, we can power up the panels!
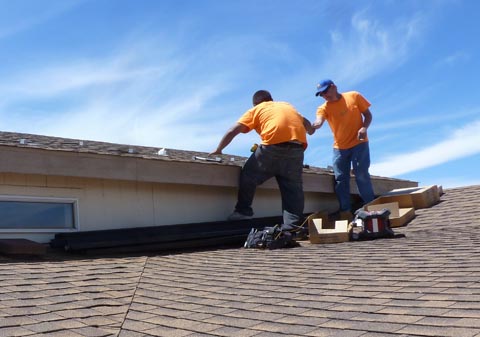
Installation Starts
Tues. May 21
Right on schedule, 12:00 noon, two installers, Chris and Joe, from Pur Solar arrived. They set up their ladder and carried a lot of supplies up to the roof. After a while, Travis, Pur Solar's president arrived and conferred with the installers and with me. After we had worked out the questionable areas, he left and the work progressed. The initial effort was in laying out the panel pattern and installing posts into the roof which hold the rails to which the panels will be mounted. This was a short day, as after commuting to and from Cottonwood, they are on site typically from about 7:30 until 2:00. As they arrived at noon today, they only worked about 2 hours, but completed the installation of the posts on the motor home garage roof.
Dissapointment! The City Strikes Again!
Tues, April 23
Oh well! The best laid plans . . .
I waited all day, making several calls with no replies and no installers. Finally I received an email from the company president stating he had been on a Hopi reservation since 3 AM with no cell coverage and just got home. He said the plan checker for the city of Prescott called and wants an engineer to sign off on the plans. We are using standard mounting techniques on a standard roof construction like thousands of previous installations, yet the city wants an engineer to approve it! Unbelievable! Who knows what that does to the schedule? The panels have truly been received and are now waiting in my contractor's warehouse for the permit to get straightened out. It will probably be at least a week delay.
Update of Tues, April 30
The engineer is supposed to have his calculations done by the middle of next week, about May 8. The plans then have to go back to the city for approval. It is looking like maybe the week of May 13 would be when they are ready, but I am on a motor home rally from the 13th to the 16th, so they will probably end up installing the week of the 20th.
PERMIT!
Update of Fri, May 17
OK, it was well over a week delay but as of yesterday late afternoon, WE HAVE A PERMIT!
I went over to Prescott Valley today to the Home Show which is running this weekend and met Travis, the president of Pur Solar. They have a booth there and are working all day today, Saturday, and Sunday. He will be here Tuesday afternoon, 5/21 to do the planning and coordinating with me, and to start the installation. He believes they will be through Friday and call for city inspection. Once the city signs off, they call APS for their inspection. When they sign off, we can power up the panels!
Installation Starts
Tues. May 21
Right on schedule, 12:00 noon, two installers, Chris and Joe, from Pur Solar arrived. They set up their ladder and carried a lot of supplies up to the roof. After a while, Travis, Pur Solar's president arrived and conferred with the installers and with me. After we had worked out the questionable areas, he left and the work progressed. The initial effort was in laying out the panel pattern and installing posts into the roof which hold the rails to which the panels will be mounted. This was a short day, as after commuting to and from Cottonwood, they are on site typically from about 7:30 until 2:00. As they arrived at noon today, they only worked about 2 hours, but completed the installation of the posts on the motor home garage roof.
| Joe and Chris are well along with the post installation on the motorhome garage roof. | Chris
is reviewing the first half of the mounts on the garage and patio
roofs. |
Wed,
May 22
Today was a full day and they finished installing the posts (also called mounts), installed all the rails (also called racks), and completed most of the roof top grounding.
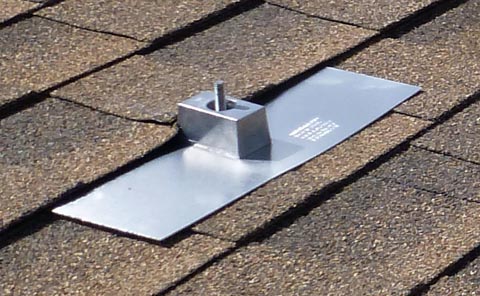
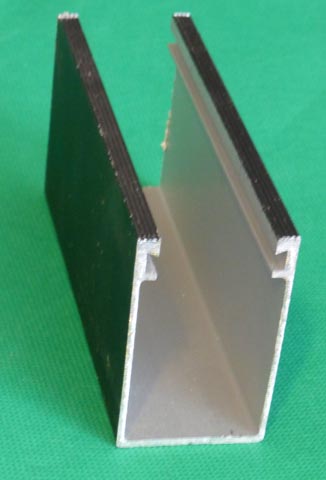
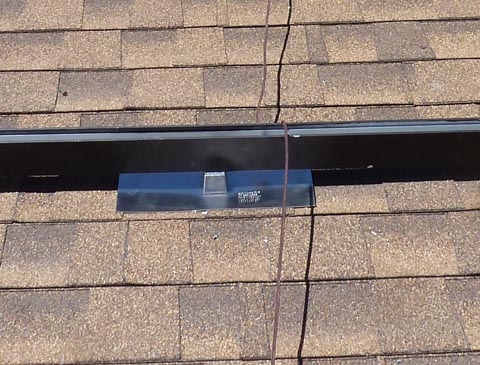
To mount the panels they first drive 6 inch long stainless steel bolts through the spacer blocks and the tubes on the aluminum flashing, through the roof, and into the roof trusses or rafters . The design of the bolt leaves a threaded stud extending out the top. They then drill the bottom of a 2 1/2 inch high aluminum extrusion to match the mounts and bolt them to the top. These rails are shaped with grooves in the top which accept slide-in clamps. The solar panels are laid on the rails and securely held down with these clamps. This leaves about a 4 inch space under the panels for good air circulation to help keep the panels cool. All the rails are grounded using a length of #6 gauge bare stranded copper wire which then continues down to the primary house ground by the main electrical panel.
Today was a full day and they finished installing the posts (also called mounts), installed all the rails (also called racks), and completed most of the roof top grounding.
To mount the panels they first drive 6 inch long stainless steel bolts through the spacer blocks and the tubes on the aluminum flashing, through the roof, and into the roof trusses or rafters . The design of the bolt leaves a threaded stud extending out the top. They then drill the bottom of a 2 1/2 inch high aluminum extrusion to match the mounts and bolt them to the top. These rails are shaped with grooves in the top which accept slide-in clamps. The solar panels are laid on the rails and securely held down with these clamps. This leaves about a 4 inch space under the panels for good air circulation to help keep the panels cool. All the rails are grounded using a length of #6 gauge bare stranded copper wire which then continues down to the primary house ground by the main electrical panel.
| The mount is a well designed assembly. It consists of an aluminum sheet metal flashing large enough to slide completely under one course of the roofing and partially under the next. This flashing has a tube about 3/4 inch long welded to the plate near the bottom in the exposed part. A spacer block fits over this tube with a water seal at top of the tube. near the top of this block. This keeps the seal well above any water flowing down the roof for longer life and a more secure seal. | This
is a section of the rack. The bottom gets drilled to bolt to
the
mount, and the slots in the top hold the clamp-down brackets that
secure the panels to the racks. |
The
racks bolt to the top of the mounts, and make for a very strong
mounting of the panels. This is needed to prevent the large
surface area of the panels from pulling the mounts out of the roof
during
high winds. This view also shows one of the ground wires. |
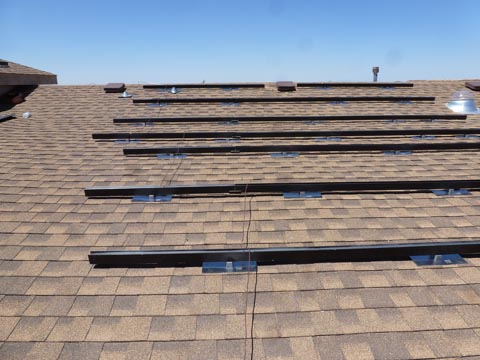
| The
racks are all installed now. |
This
view from my video camera shows all the installed racks. It
looks
like my camera gives me just shy of total coverage! |
Electrical
Wiring and Rough Electrical Inspection
Thurs. May 23
Today Chris came by himself. After completing the grounding and calling for the city inspection of the racks, he spent his day installing electrical components and wiring. He did a nice job of keeping the conduit runs neat and mostly out of sight. The wiring is more complex than one would think. The panels have their own cables with special buss type connectors which in my case, join twelve panels together for each of two circuits. These cables each terminate in an electrical box and conduit runs are made from each down to the garage attic. from here they pass across the attic and down an inside garage wall to a combiner box which takes the two circuits, passes each through a 15A breaker and exits as a single 30A circuit. It then passes out through the garage wall to a meter which keeps track of the total solar output, then to a disconnect box, back through the garage wall and across to the rear of the main breaker panel and in to a 30A breaker, where the power is fed to the grid.
About an hour after Chris left for the day, the city inspector arrived, did a brief inspection, and signed off the work so far.
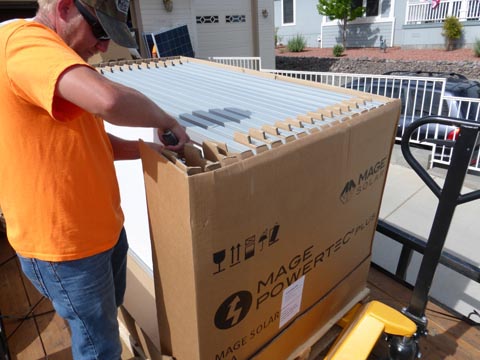
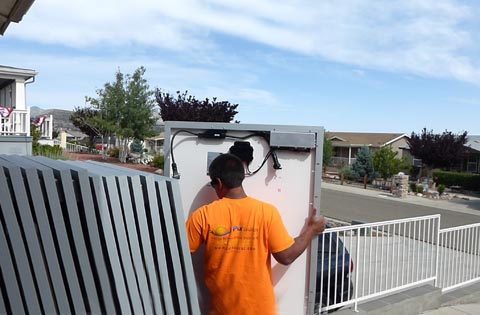
Chris is removing the protective packaging from the panel connectors and Joe is stacking the panels against the front of the garage ready to be
handed up to the roof.
Here is a view of the finished panel installation.
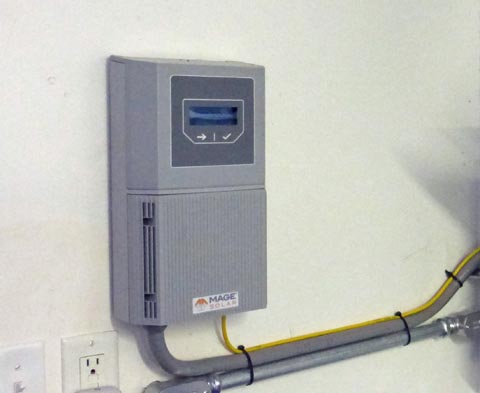
The data manager is installed on the front garage wall. They did a very neat job
of all their wiring.
Time Lapse Video
During the course of the installation, I was making a video of the activity on the roof. After I had the full length files of each day of work, I processed them to speed them up, removing some of the time when nothing was happening. I ended up with a video which runs 256 times real life speed. This puts about 17 hours of on-roof work into about a 4 minute clip. My cameras did not capture any of the work performed in the attic or on the ground, only the roof. To see this video please CLICK HERE FOR TIME LAPSE VIDEO. As you watch this high speed video, it will seem at times like there are 3 or even 4 men working at one time on the roof. Except near the beginning when Travis (in the blue shirt) comes to verify the job and instruct his installers, there are never more than 2 men on the roof.
Friday, May 31 to Sunday, June 30 Waiting and Frustration!
7/3/13 We're Up and Running!
Hallelujah! We have power!
Today, 15 minutes early, both the APS inspector, Larry (from Phoenix), and the Pur Solar installer, Chad arrived to finalize my system. Chad came in the vacationing Travis' place. Larry checked over the wiring of the various meter, disconnect, and combiner boxes while Chad installed yet more custom labels on the various electrical boxes, including a couple of junction boxes on the roof. These labels all warn future service personnel about the possibility of voltage where they might not expect it due to the solar components.
Larry checked the output of the system and measured 17 and 17.5 amps on the two sides of the power line for a power output of over 4000 watts. The power varied due to scattered clouds. He said that someone else from APS would be out within 10 days to replace both meters with their appropriate "smart meters". Until then I cannot receive credit for excess power generated. Actually, that is not really true as the meter I have truly "runs backward" (decreases the count) when I am generating more than I use, so I really am getting credit. He put a bright and shiny brass APS padlock on the disconnect box and said all was good.
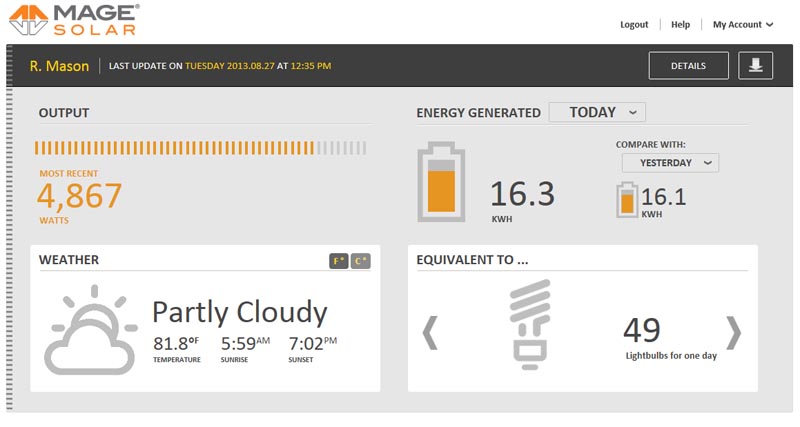
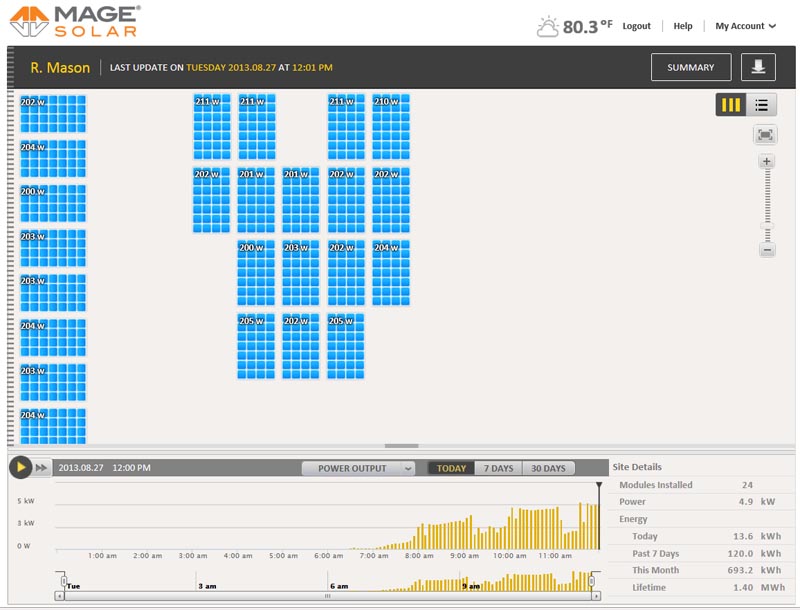
I asked Chad about programming the data manager and he replied that Travis would have to do that next week after returning from vacation. As soon as they left, I got out the manual and programmed it. I can now read out just about any performance detail on the built in LCD readout, and, more importantly, read all that information in graphical format on my local computers. This information is updated every 5 minutes. I will not have global access to this data until Pur Solar and Mage work to set up a website for me.
Panel Monitoring
The solar system came with a module called the Data Manager. This box connects to the solar modules via the AC line and sends and receives data to and from each panel. It collects all the performance data and makes it available via a network connection to my computer system, or by an Internet connection to a site, called a portal, operated by the panel manufacturer. Either of these connections allows you to read out the current performance, the past performance (with some difficulty) and status and diagnostics. These readings can be made for the system as a whole, or for individual modules.
I am a happy camper!
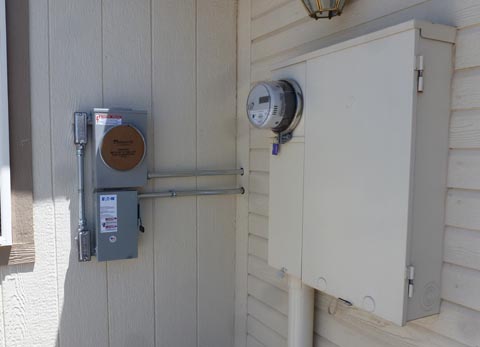
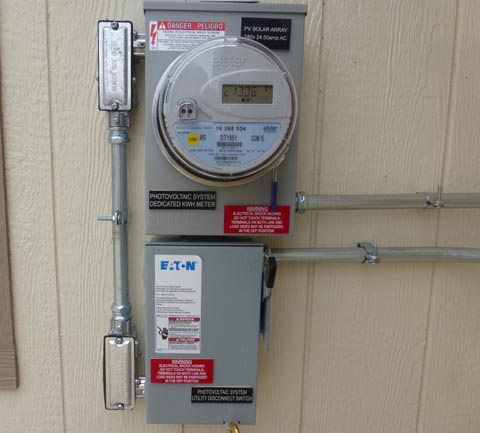
7/8/13 New Meters
It's amazing! APS actually came out today and replaced both my meters in well under the 10 days they had promised! With the replacement of the meters, I should now be able to receive credit for any excess power I generate, not that there is much chance of that happening right now. We are in the Monsoon season with much cloudiness and high temperatures. Between the reduced power due to clouds and the high need for air conditioning, this is not the time I will be building up much credit!
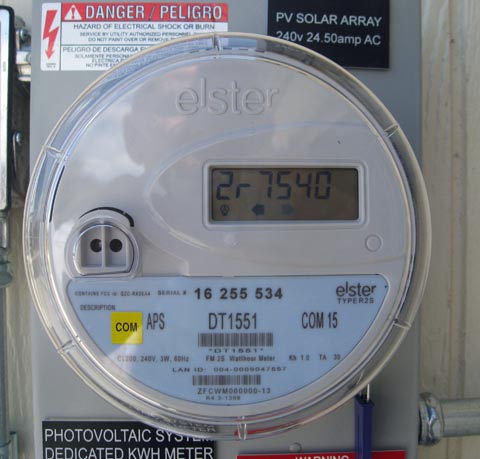
These are my new "smart meters". The one on the left is my solar meter which measures the total output from my solar panels. The reading on this
meter is totally independent from any power I use from APS or send back to APS, but just shows the total solar energy I generate whether it is
used by me or is sent to the APS grid.
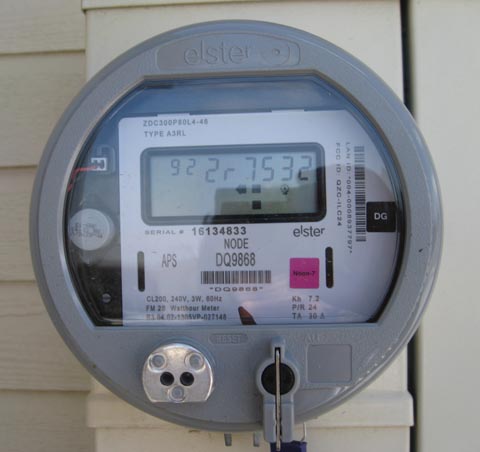
The meter on the right is the main meter. It replaces the meter I have always had and among other things, it tells how much electricity APS has
supplied me and how much electricity I have fed back into the APS grid.
That should pretty well finish all the hardware for my system. There is still a little software in the form of the data reporting portal to be finished, and that seems to be moving along. I received the portal address this afternoon, and should be a little more familiar with it's operation shortly.
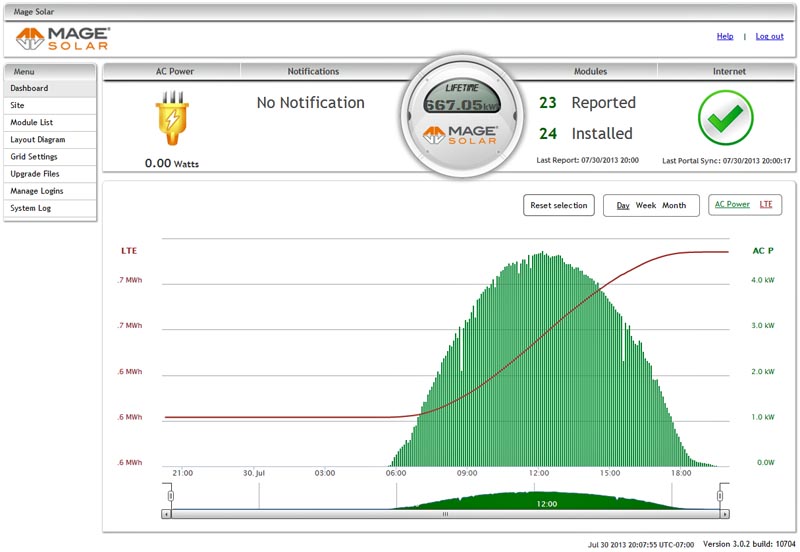
Yesterday was my best "solar day" yet with my panels producing 36.27 kWh. We had a nearly cloud free day. The bar chart
shows an almost perfect bell shaped curve, with just a few minor dips due to small clouds quickly passing over.
Insertion of 1/2/15 More panel comparisons
The comparison of the various panel configurations shown above was taken on 7/30/2013 and involved a lot of individual readings and calculations. I have since streamlined the calculation process considerably by downloading a day's performance data from my data manager into an Excel spreadsheed. This one day file of data includes the output from each panel every 5 minutes for a total of 6912 records. Then by use of a rather complex macro, I can let Excel do all the calculations automatically in a matter of seconds. I ran several more comparisons at various times of the year. As I suspected, my excellent balance was due to the sun being very high in the sky. The difference between the 3 groups of panels was much greater during the winter months. The worst balance I saw was in late December where I had an energy loss of almost 1/3 for the east facing panels. After taking a few samples during the first year, I ran a 1 year average. The 1 day samples below were taken on cloud free days. Of course the yearly sample takes into account the full range of clear, clouds, rain and snow as it happened during the year. I also ran samples just a few days apart in early January, one on a clear day, and the other on a cloudy day. The results of the clear day were slightly better than the ones shown for the end of December, while the ones for the cloudy day showed less than 1% difference for any group, but a much lower total output of course. The clouds obviously diffuse the light so that each panel receives an almost equal amount.
I noticed that on the summer samples there were times when the "oddball" orientations were even better than the "optimum". All of these imbalances were small. The full year average balance is better than the individual numbers might suggest. This is because the high output summer months out-weigh the much lower output of the winter months and skew the average. Also any cloudy days tend to slightly reduce the spread due to their almost perfect balance.
Taking a weighted average of the efficiencies, my overall yearly loss due to poor panel orientation is 6.83%, compared to having all the panels facing south at an 18 degree elevation. The extra 1.64 panels it takes to make up this loss is less expensive than the mounting hardware it would have taken to mount all the panels optimally, if that were even possible. I think my present configuration is a good compromise.
8/2/13 My Contribution
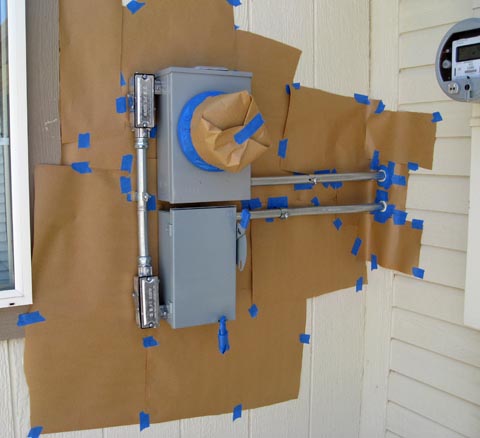
Today I made my biggest personal contribution (other than writing checks) to the hardware of my solar system. I painted the outside meter and switch boxes. The battleship gray just didn't blend in with my beige colored house. I was fortunate to find a high quality spray paint that very closely matched my outside wall color. It matched better than my left over quantities of the original paint!
APS gets nasty (greedy)!
Since this project started, APS has made an announcement that they want to eliminate net metering and charge solar users much more money. They quote some ridiculously low numbers as their perceived value of residentially generated power stating it is worth only the bare cost of fuel to generate the power, or about 3.6 cents/kWh. A study commissioned by APS several years ago showed the value to them then at about 14 cents/kWh, well over the then retail price of power. They now say there is no longer any value to them in the infrastructure costs they will avoid, the transmission losses they avoid, the new power plants they avoid having to build, the boost in capacity they receive during heavy demand times, and the renewable energy quotas they must meet. Yet they have no problem delivering this "worthless" power to your next door neighbor and charging full retail price with essentially no other expenses. The solar industry has done a study showing that APS is receiving over double the value of what they pay (or do not get to charge) for our solar power. APS has long been granted status as a monopoly with a guaranteed profit of 10%. They should not be attacking the solar regulations that were established for the greater good of all!
APS has already gone before the Arizona Corporations Commission with their proposal. It will be months before the ACC makes their decision, and then months more before any of the changes are incorporated. I hope they do not accept the distorted numbers APS is feeding them. If net metering is done away with, it will do unbelievable damage to the growing solar industry in Arizona and the efforts to move away from fossil fuels. APS has already succeeded in having the incentives cut way back on commercial solar installations resulting in a decline of about 70% of new commercial solar construction. Currently the solar industry in Arizona employs almost 10,000 workers, or 1 in every 306 so a lot is at stake!
Apparently any changes will not affect my personal situation as I am supposed to now be "grandfathered" in for the next 20 years. At this time I am just not going to worry about how I will feel about it all when I am 96 years old!
8/6/13 Problems Get Fixed!
This morning I received a phone call from a product engineer at Mage. He has been reviewing my "unreported module" situation. He asked if I would be able to access the problem panel. When I told him I could, he asked me to turn off the circuit breakers for the two strings of panels, then cover the problem panel with something light tight for about 15 to 20 seconds. This removes the power from both ends of the micro-inverter (from the AC grid and from the solar panel) and allows a total reset of its electronic circuitry. I found a couple of black trash bags that together would lay flat and cover the entire area of the panel. That didn't work too well! There was enough wind that by the time I taped one end of the bag and moved to tape the second, the wildly flapping bag pulled the first end free. I then searched for an alternate material. I found a roll of thick black plastic about 1/32 inch thick and 18 inches wide I had acquired years ago for a project. I cut 3 lengths and laid them overlapping side by side, and it worked great. The plastic was heavy enough that the wind didn't bother it. The micro-inverter reset and started producing power. We will follow it closely for a couple of weeks to make sure it doesn't fail again. If it does, he already has the paperwork filled out to ship me a new panel. While following up via email, I asked him about one other minor problem, an error notation under the grid profiles for 4 of my panels. He called me again and walked me through re-loading of the profiles, and totally eliminated that problem.
We also discussed some of the features of the new monitoring firmware which is supposed to be released in several weeks to Mage customers. It sounds like it will truly perform all the functions I have found missing with the current firmware. I am thrilled!
8/8/13 My First Bill
This morning my new electric bill showed up on the APS website, covering July 9 to August 7. It is a total of $29.76 for 137 kWh that I did not generate myself! Reviewing all my data, I estimate that I used about 885 total kWh this month which would normally cost around $140. Last year I used about 1100 kWh in July, and it cost $180!
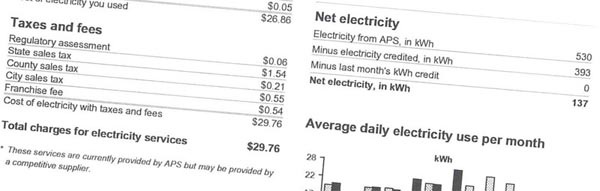
I am thrilled by my first electric bill since activating my solar system!
My previous estimate that I was generating well over 2/3 of my energy was conservative: I generated 84.5% of it! This is wonderful, considering how many days of low output I have had due to cloudiness and other factors. July will always be a difficult month, as it has my highest consumption of the year, however next year I expect to have built up some credit from the previous months to help offset the higher usage.
I no longer have a single point of reference as to how much total electricity I am using. The power company online daily data only show how much APS supplied me, and the monthly bill shows that and how much I supplied APS. They do not account for how much I use directly from the solar panels. To get an accurate figure, I would have to read my solar meter at the same time they record my other readings, so instead, I use the figures my data manager gives me for about the same time period. It should be quite close. I had no idea of just when APS recorded the billing meter readings, but by some detective work, I determined that it is at midnight on the start of the final billing day. So the meter reading for August 7 is taken at the end of the 6th.
Needless to say, I am overjoyed with this bill! For most of this period I have been getting output from only 23 of my 24 panels. For a couple of days after APS installed my new meters, I only had about half my panels working, until I was instructed to do a reset and how to do it. With that and all the cloudiness, I expected much less yield. It should only get better from here!
Insertion of 9/10/13 My Second Bill
This morning I found my second APS bill on-line covering August 7 to September 9. I didn't quite keep up this month either. I generated 52 fewer kWh than I used. My bill was for $20.89. This month I generated about 94.1% of the approximately 884 kWh I used.
Insertion of 10/10/13 My Third Bill (and First Credit Balance!)
No, I'm not going to post each and every bill I get. This should be the last one, unless I post some kind of a summary much later. I just had to post this one, as it is the first month I finished with a CREDIT BALANCE! I generated 184 kWh more than I used this month for a total bill of $13.42. I guess this will be about the amount of my monthly bill any time I have a credit balance. Of course the balance carries forward each month. At the end of the calendar year, if I still have a balance, they will buy my excess electricity from me for slightly less than 3 cents a kWh. So I guess you could say that I earned about $5 in excess electricity this month! Woo Hoo! Actually I probably earned over 3 times that much if it goes to offset times when I don't generate as much as I use. I am paying just under 11 cents a kWh from APS (including taxes) for that electricity. A great thing about my solar is that even if I fail to meet my monthly usage, I am almost assured of my usage being low enough to stay in the first tier of their rate structure for the lowest cost per kWh. Prior to my solar, I was always in the 2nd tier, and occasionally the third and paid much higher costs per kWh.
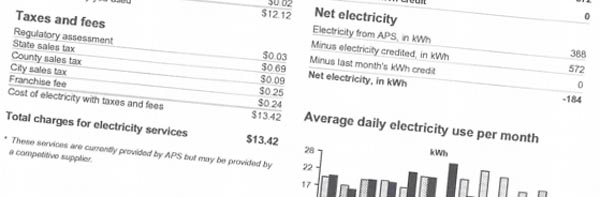
I like this bill even better than the first two!
This last billing month started out with clouds and I dropped to a credit balance of -40 kWh. Then the rest of the month was pretty clear and I had a credit balance averaging about 7 to 10 kWh each day, leaving an eventual balance of 184. I generated about 127% of my total usage of about 685 kWh. A good month!
As of today, I am within 20 kWh of generating my total usage since the panels were powered up!
Insertion of 10/13/13 Positive lifetime balance
Today my panels met a milestone. I have now generated more energy with my panels than I have used in my household during the total time I have had the panels activated! During the day I went from a -4 kWh lifetime balance in the morning to a +3 balance at the end of the day. The clear weather we have been having looks to continue, with this balance increasing each day.
Insertion of 1/2/15 One Year Summary
I have had the solar system running for about 1 1/2 years now and the performance has been outstanding. I decided to look at my most recent one year period. From 12/8/2013 to 12/8/2014, I generated 702 more kWh than I used, for a total output of 10,473 kWh.. For this period, my yearly electric bill was a total of $175.01. My average yearly bill the 3 previous years was $1265.20 resulting in a direct savings of $1090.19 for this year.
My bill would have been even less, except that APS pays off any positive balance at the final bill of the year, which comes in early December for me. Then as the days are very short at this time of the year I was using more than I generated. My December and January bills were each about $12 or $13 higher than they would have been. By February I was generating excess power again. While it is not a lot of money, it is still frustrating to have them buy my balance at less than 3 cents per kWh and then immediately sell it back to me at about 11 cents. My balance would have easily carried me through my couple of negative balance months.
Even with this minor frustration, the panels have already paid for themselves, even if you only consider that they have added more resale value to my house than I had to pay, and this is with no increase in property tax! My yearly direct savings only improve the bottom line. So far I am on track for a full cash payback in a little over 7 more years (a total of 8.8 years). I am over 1/6 there!
8/17/13 The Meter-cams
Over a period of several weeks I developed and installed a couple versions of what I call my Meter-cams. They constantly view my two electric meters through my security system and let me easily keep a log of my performance.
I installed cameras with night time illumination on both of my electrical
meters. This allows me to easily keep track of the "official" performance
of my system.
Progress and Arrival of the New Software
Things have been progressing smoothly. The "problem panel" apparently had somehow gotten a glitch into it's computer system. The total reset I did on that panel seems to have solved all its problems, and it is still operating perfectly, as are all the other panels.
August started out quite sunny, and I quickly built up a positive energy balance of about 58kWh. The last week or so, the Monsoon clouds have returned and are slowly eating away at my balance for the month. I am well over half way through this billing cycle and still have a small credit balance, but the forecast storms are sure to eliminate that by the end of the weekend. When the skies clear, it will rebuild. It is all a statistical balance.
I received an email from Mage a couple days ago that states I should have the new monitoring software (version 4.0) in the next week. They also included a short video showing some of its functions. It seems to be a much more comprehensive package than what I have now, and truly seems to do everything I find missing in the current version. I can't wait!
Shortly after writing the above paragraphs, I logged onto the portal. It came up with the new software! I am very pleased with what it does and the information it allows me to see.
The new portal software is a major improvement over the old. To see details of both the old and the new versions, you can CLICK HERE FOR SOLAR MONITORING DETAILS
Conclusions
I was into my 5th month of this project before we could turn the switch and start generating power. I certainly was not prepared for it to take anywhere near that long considering the actual installation took about 5 working days, but excessive delays with the city during the permitting process, and with APS delaying their approval process just kept stretching it out. OK, "5th month is a little misleading. The total time duration was about 3 1/4 months when you account for the partial first and last months, but it seemed much longer. There were a couple of "rough edges" initially, which my installer said was "very unusual", but they all got straightened out within about the first month.
The very day APS approved the installation was the first day of heavy Monsoon clouds. They were with us pretty much through the entire month of July. August started off with mostly clear skies with just occasional cloudiness. The heavy clouds and the fact that I use more electricity in July than in any other month have kept me from producing more power than I use, but indications are that that will truly happen. (Inserted 10/24/13:) In fact my 3rd month had a large positive balance, and just into my 4th month, I reached the point where I have generated more power than the total I have used since turning the panels on! I really am pleased with the results so far. As I now have the new monitoring software, which is much, much better than the original, I am (mostly) totally happy!
As you probably have noticed, I am treating this solar installation as much more than just a way of reducing my power bill. It has been a marvelous extension of my hobbies. I am spending much more time than is practical tracking all the numbers, following the trends I see with time, and just trying to find out everything there is to find out about my system. I have been, and am still deriving a lot of pleasure calculating facets of the system that most (sane) people just ignore.
Thanks for persevering with me through all the stages of this endeavor, it has been fun!
Thurs. May 23
Today Chris came by himself. After completing the grounding and calling for the city inspection of the racks, he spent his day installing electrical components and wiring. He did a nice job of keeping the conduit runs neat and mostly out of sight. The wiring is more complex than one would think. The panels have their own cables with special buss type connectors which in my case, join twelve panels together for each of two circuits. These cables each terminate in an electrical box and conduit runs are made from each down to the garage attic. from here they pass across the attic and down an inside garage wall to a combiner box which takes the two circuits, passes each through a 15A breaker and exits as a single 30A circuit. It then passes out through the garage wall to a meter which keeps track of the total solar output, then to a disconnect box, back through the garage wall and across to the rear of the main breaker panel and in to a 30A breaker, where the power is fed to the grid.
About an hour after Chris left for the day, the city inspector arrived, did a brief inspection, and signed off the work so far.
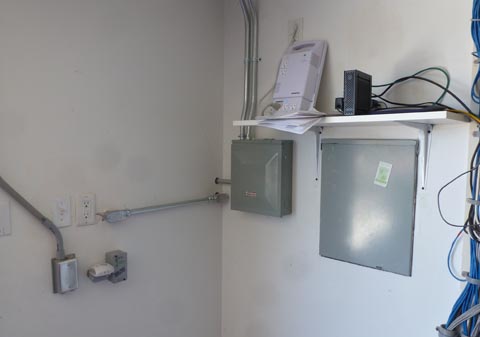
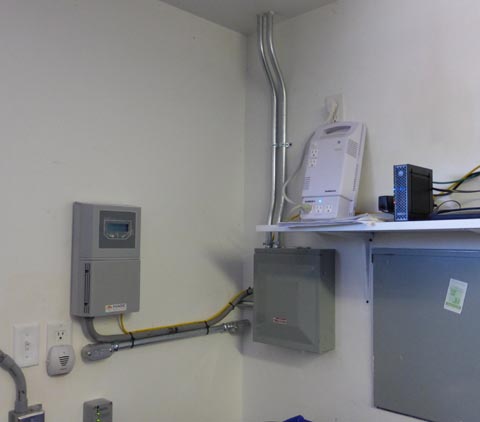
| I
had originally thought maybe they would squeeze the meter and the
disconnect switch to the left of the main box on the garage outer
wall. They could not do that as the code states that a man
must
be able to stand directly in
front of it to read it (or probably the
dimensional equivalent), so they mounted them on the house
wall. I think that works great. |
The two conduits from the attic contain the wiring from each of the two banks of solar panels and run down to the combiner box. The two banks connect to two circuit breakers in this box, and feed out as a single conductor through the wall to the solar meter box, which then connects to the disconnect switch. The horizontal conduit on the front wall of the garage carries the power from the disconnect switch to the main breaker box. Doing it this way avoided the problem of trying to go around the main conduit on the bottom of the panel, or having to go over and around the panel. You cannot wire from the left side where the power company runs its feed to the meter. |
Fri.
May 24
Panels Arrive
The installers arrived bright and early this morning with a flat bed trailer containing a huge carton. They brought the carton with only 7 panels in it today. The one at the office has the other 17. With the holiday weekend, it looks like they will finish Tuesday.
The installers just left. They installed 7 of the 8 motor home garage roof panels and completed pretty much of all the wiring.
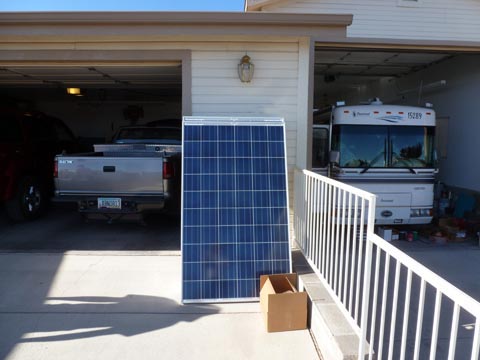
| The
panels arrived in a huge cardboard carton on a pallet. Full,
it
holds 17 panels. Obviously the factory shipped one full and
one with 7
panels to make the total of 24. Today they brought the one
with 7. Here we see the 7 panels ready to be handed up to the roof. Shown in the garage is my electric truck. Soon I will be able to drive it with absolutely no cost for fuel by charging it from my solar! |
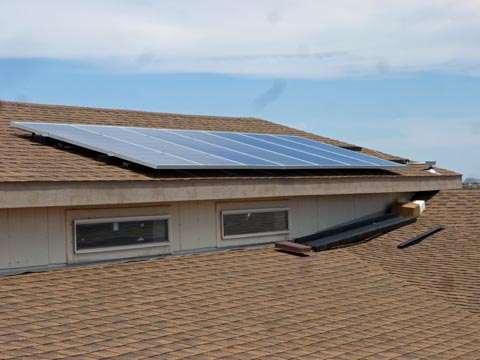
And here the 7 panels are installed on the motor home garage roof! There will be one more panel on the right, then the remaining 16 will be on the garage and patio roofs. The actual mounting went very fast, taking less than 15 minutes for the 7 panels. It took much longer to bring the panels up to the roof and to record the serial numbers to accurately identify the location of each panel in the monitoring software. |
Tuesday
May 28
The installers pulled in this morning with the crate of 17 panels. They handed the panels up to the roof and set them around the various clear areas of the roof. After all the panels were up, they started to set them in place. They worked until about 1 1/2 to 2 hours after their quitting time and finished the installation except for a couple of minor items. They ran out of the brackets which secure the outer edges of the panels and they need to bring the meter to mount in its box. They spent a lot of time on the roof tying up cables and painting various fittings. It really looks nice.
Then they installed the data monitor in the garage. This is the unit which communicates with all the panels and collects their performance data. It connects to my home network, and therefore the Internet. It allows me to log directly into it to access the data on my computers, and it also sends this data to the portal supplied by the inverter manufacturer. I will then be able to log into their site from anywhere and get all my current and historical performance data.
The city inspector is scheduled to come for the final inspection sometime Thursday.
Chris is removing the protective packaging from the panel connectors and Joe is stacking the panels against the front of the garage ready to be
handed up to the roof.
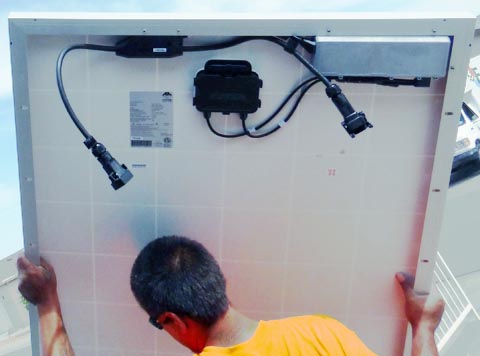
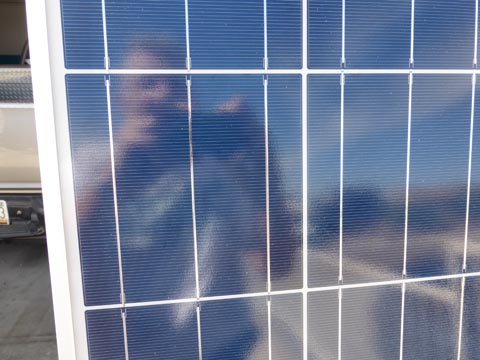
| This is a view of the back (bottom) of the panel. The black item in the center is the standard panel interconnection box. On this factory AC panel it is connected to the micro-inverter in the upper right corner. The heavy black cables are the AC interconnection cables and connectors. | A close up of the front of the panel shows several of the square cells and all their silver interconnection traces. The cells are about 6 inches square. (See the faint outline of the cells in the picture to the left.) This picture also provides a self portrait of the photographer. |
Here is a view of the finished panel installation.
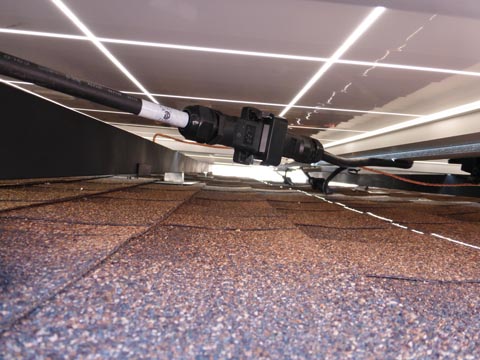
| The
panel wiring was done very
neatly. |
Looking under the panels shows the AC interconnection cables. |
The data manager is installed on the front garage wall. They did a very neat job
of all their wiring.
Thursday,
May 30 Final Inspection and City Sign-off
Chris came early this morning and finished the tasks that remained to get ready for inspection. He installed the missing panel edge hold-downs, he installed the meter that measures the total power produced by the solar panels, and he added several special labels needed on the various solar related power panels. The city inspector arrived about 10:30 and signed off on the total project. Now we need the APS inspection and we can power up the panels. Chris quickly turned on the power to test the system and it truly worked.
Chris came early this morning and finished the tasks that remained to get ready for inspection. He installed the missing panel edge hold-downs, he installed the meter that measures the total power produced by the solar panels, and he added several special labels needed on the various solar related power panels. The city inspector arrived about 10:30 and signed off on the total project. Now we need the APS inspection and we can power up the panels. Chris quickly turned on the power to test the system and it truly worked.
Time Lapse Video
During the course of the installation, I was making a video of the activity on the roof. After I had the full length files of each day of work, I processed them to speed them up, removing some of the time when nothing was happening. I ended up with a video which runs 256 times real life speed. This puts about 17 hours of on-roof work into about a 4 minute clip. My cameras did not capture any of the work performed in the attic or on the ground, only the roof. To see this video please CLICK HERE FOR TIME LAPSE VIDEO. As you watch this high speed video, it will seem at times like there are 3 or even 4 men working at one time on the roof. Except near the beginning when Travis (in the blue shirt) comes to verify the job and instruct his installers, there are never more than 2 men on the roof.
Friday, May 31 to Sunday, June 30 Waiting and Frustration!
This period has not
made me a fan of APS! I waited about two
weeks for a call from APS setting up my solar rate plan and scheduling
the APS sign-off of my system. Until that is done I cannot
power
up the system. All that fine electrical generating equipment
has
to just sit idle!
On Thursday, June 13 I was enroute to San Luis Obispo, Califormia to see my granddaughter graduate from Cal Poly University, and I got a call on my cell phone. I had forwarded my home phone to my cell. It was a lady from APS who went through the choices of rate plans and said I was scheduled for my APS inspection on June 26. Upon returning home I contacted Travis with this information. He went through a number of emails back and forth with APS - they had no record of my appointment! A fellow from the Prescott APS agreed to do the inspection on Friday June 28 at 8 AM. Wednesday we received an email from him stating that his wife had just gone into labor - and he canceled his appointment. Finally, an inspector in Phoenix agreed to come on Wednesday, July 3, time not yet specified. We'll see.
And that is where we are on the last day of June with absolutely no progress this entire month!
7/3/13 We're Up and Running!
Hallelujah! We have power!
Today, 15 minutes early, both the APS inspector, Larry (from Phoenix), and the Pur Solar installer, Chad arrived to finalize my system. Chad came in the vacationing Travis' place. Larry checked over the wiring of the various meter, disconnect, and combiner boxes while Chad installed yet more custom labels on the various electrical boxes, including a couple of junction boxes on the roof. These labels all warn future service personnel about the possibility of voltage where they might not expect it due to the solar components.
Larry checked the output of the system and measured 17 and 17.5 amps on the two sides of the power line for a power output of over 4000 watts. The power varied due to scattered clouds. He said that someone else from APS would be out within 10 days to replace both meters with their appropriate "smart meters". Until then I cannot receive credit for excess power generated. Actually, that is not really true as the meter I have truly "runs backward" (decreases the count) when I am generating more than I use, so I really am getting credit. He put a bright and shiny brass APS padlock on the disconnect box and said all was good.
I asked Chad about programming the data manager and he replied that Travis would have to do that next week after returning from vacation. As soon as they left, I got out the manual and programmed it. I can now read out just about any performance detail on the built in LCD readout, and, more importantly, read all that information in graphical format on my local computers. This information is updated every 5 minutes. I will not have global access to this data until Pur Solar and Mage work to set up a website for me.
Panel Monitoring
The solar system came with a module called the Data Manager. This box connects to the solar modules via the AC line and sends and receives data to and from each panel. It collects all the performance data and makes it available via a network connection to my computer system, or by an Internet connection to a site, called a portal, operated by the panel manufacturer. Either of these connections allows you to read out the current performance, the past performance (with some difficulty) and status and diagnostics. These readings can be made for the system as a whole, or for individual modules.
| The
data manager is the brains of the monitoring system. It
communicates with the solar modules, processes the data, and sends them
out over the network to both my local computers and the Internet. |
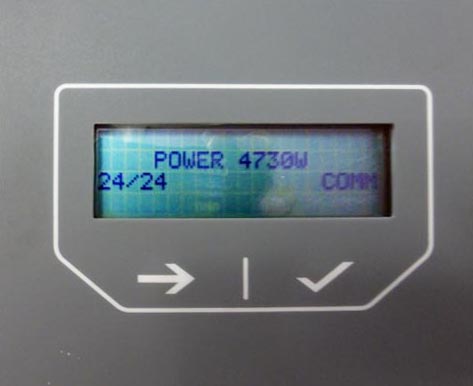
At any time
you can look at the display on the power manager and see
the current power output. It is also showing that all 24
modules are
being accessed, and that the communication link is active.
Using the
arrow and check buttons, you can access a wide variety of menus, set-up
operations, and the values for a large number of items.
|
Once I was able to
monitor the output on my computer, I noted that each
reading was considerably lower than the last one. I looked
outside and saw the sky full of dark monsoon thunderclouds, the first
of this season. The
power dropped to a few hundred watts as the clouds closed in.
The
following day we had high scattered clouds in the morning and the
readings varied. I did see a high reading of 5421.7
watts.
This is closer to the system rating of 5880 watts than I thought I
would ever get. The Standard Test Conditions (STC) is with
perfect alignment to a 1000 watts per square meter source and a 25
degrees C (71 F) panel temperature. Real world conditions are
seldom that good.
I am a happy camper!
I
do have some reservations about the capability of the current
computer software. It makes it difficult to see the previous
performance
and even some facets of the current operation.
Skipping
ahead in time for a
moment, it turned out,
a little over a month after starting operation, the factory came out
with a new, much improved version of their portal software which
answered most of my concerns. You can see the details of both the
original and the new monitoring software a little later in this writeup.
The
Stick-cam
I wanted to measure
the output
from specific panels to see what effect the easterly vs. southerly
orientation and the different slope values of the roof made.
In
order to do this, I need to know which panel serial number is in what
position. The installers wrote down this information as they
installed the panels, but I don't have a copy, and being impatient, I
decided I would
determine myself which panel was installed where. The data
manager as connected to my computer gave me a complete list of the
serial numbers it found. It was then necessary to match these
numbers with my physical panels.
I started by using a mirror to look at the barcode labels on the bottom sides of the panels. (I know - low tech!) They are located about 4 inches below the top edge and about 2/3 of the way across the panel width. I was able to read the numbers (with a couple of errors - it's hard to read numbers in a mirror!) on 14 of the panels. I just had no access to the balance.
To read the balance, I decided I needed a "stick-cam", so I built one. (At last, high tech!) I mounted a very small black and white video camera I already had, on a stick about 4 1/2 feet long. The camera is only about 5/8 inch in each dimension. I also mounted an LED for illumination, a 9 volt battery pack and a switch. For a monitor I connected the output to my motorhome GPS which has an input for a backup camera and makes a nice, portable video monitor.
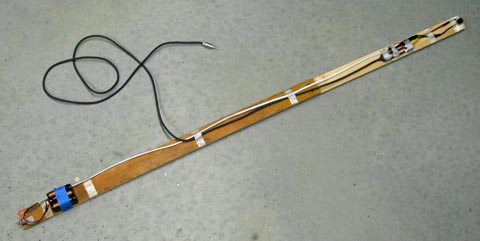
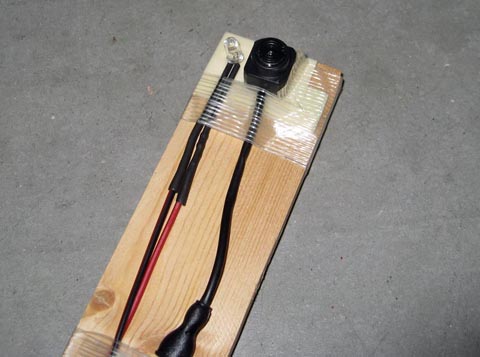
This is my completed stick-cam. It took about an hour to build. Double sticky foam and
strapping tape work wonders! On the right is the camera and the LED. The camera really is tiny.
Using this camera I was able to eventually find all the hard to reach bar codes and easily read the last 3 digits. I had determined from the list of numbers that 3 digits would uniquely identify each panel. Locating some of the bar codes was quite challenging, but I managed to get all of them. One of them had me reaching almost an arm's length under the panels to get the stick far enough to find the bar code. A longer stick would have helped here. I was very pleased to see that my position of the panels agreed exactly with the installers', once I got their layout.
After matching the serial numbers with the physical locations, selecting one panel from each mounting location, and reading the daily output of each, I realized the difference in orientation and slope produced power that was less than 3% different between the best and the worst. I am very pleased. I will do more power comparisons when I get more and cleaner data. So far I have had intermittent clouds each day and since the east facing panels produce significantly more power in the morning and drop off earlier in the afternoon than the others, the exact timing of the cloudiness can significantly affect the comparisons.
I started by using a mirror to look at the barcode labels on the bottom sides of the panels. (I know - low tech!) They are located about 4 inches below the top edge and about 2/3 of the way across the panel width. I was able to read the numbers (with a couple of errors - it's hard to read numbers in a mirror!) on 14 of the panels. I just had no access to the balance.
To read the balance, I decided I needed a "stick-cam", so I built one. (At last, high tech!) I mounted a very small black and white video camera I already had, on a stick about 4 1/2 feet long. The camera is only about 5/8 inch in each dimension. I also mounted an LED for illumination, a 9 volt battery pack and a switch. For a monitor I connected the output to my motorhome GPS which has an input for a backup camera and makes a nice, portable video monitor.
This is my completed stick-cam. It took about an hour to build. Double sticky foam and
strapping tape work wonders! On the right is the camera and the LED. The camera really is tiny.
Using this camera I was able to eventually find all the hard to reach bar codes and easily read the last 3 digits. I had determined from the list of numbers that 3 digits would uniquely identify each panel. Locating some of the bar codes was quite challenging, but I managed to get all of them. One of them had me reaching almost an arm's length under the panels to get the stick far enough to find the bar code. A longer stick would have helped here. I was very pleased to see that my position of the panels agreed exactly with the installers', once I got their layout.
After matching the serial numbers with the physical locations, selecting one panel from each mounting location, and reading the daily output of each, I realized the difference in orientation and slope produced power that was less than 3% different between the best and the worst. I am very pleased. I will do more power comparisons when I get more and cleaner data. So far I have had intermittent clouds each day and since the east facing panels produce significantly more power in the morning and drop off earlier in the afternoon than the others, the exact timing of the cloudiness can significantly affect the comparisons.
7/8/13 New Meters
It's amazing! APS actually came out today and replaced both my meters in well under the 10 days they had promised! With the replacement of the meters, I should now be able to receive credit for any excess power I generate, not that there is much chance of that happening right now. We are in the Monsoon season with much cloudiness and high temperatures. Between the reduced power due to clouds and the high need for air conditioning, this is not the time I will be building up much credit!
These are my new "smart meters". The one on the left is my solar meter which measures the total output from my solar panels. The reading on this
meter is totally independent from any power I use from APS or send back to APS, but just shows the total solar energy I generate whether it is
used by me or is sent to the APS grid.
The meter on the right is the main meter. It replaces the meter I have always had and among other things, it tells how much electricity APS has
supplied me and how much electricity I have fed back into the APS grid.
Both meters read
out a number of values. The solar meter has 7
different readings, several are administrative in nature, such as time,
the revision
numbers of the meter firmware and the radio firmware, and the network registration status (I don't know what that is either!). It lists the total energy
produced by the panels, the energy produced during peak times, and the maximum kW demand. The main meter lists 11 different items with
administrative ones similar to the solar meter, a display test, and values for kWh used, kWh sent to APS, and kW, for on peak times and the totals.
Since my billing plan does not differentiate between peak and off-peak times, the only three values I care about from the meters are the total energy
produced by my solar system, the total kWh supplied by APS to me, and total kWh supplied by me to APS.
Both meters send
their values to
APS by
radio every hour of the day and night. With these meters
active,
I can now go to the APS website and see how
much APS supplied me either on a day by day basis, or if I select a
single day, I can see how much I used every hour of that day.
Unfortunately, this excellent reporting is only for that one parameter
of the main
meter. I cannot see any information on the amount I send back
to
APS, or any information from the solar meter. At the end of
the
billing period, on my bill, I am given
the amount I have used from APS, and the total monthly credit I have
earned, but still nothing from the solar meter, so I have
to take my own readings and do the math to find my total electrical
consumption
Early,
on the day APS came out to
install the meters, one of my panels failed to be recognized by the
data manager. I noted this, but was more concerned about my
impending APS visit.
Somehow in the process of installing the meters, APS must have created significant electrical noise or a spike, as almost half my modules "alerted". This means that they detected something wrong and shut down to protect the system. Within a couple of days I got the word from the factory, through my dealer, to do a reset, which they told me how to do. All the panels came back to normal operation except the one that had not been recognized earlier. We will have to see what the problem with that one is.
Somehow in the process of installing the meters, APS must have created significant electrical noise or a spike, as almost half my modules "alerted". This means that they detected something wrong and shut down to protect the system. Within a couple of days I got the word from the factory, through my dealer, to do a reset, which they told me how to do. All the panels came back to normal operation except the one that had not been recognized earlier. We will have to see what the problem with that one is.
That should pretty well finish all the hardware for my system. There is still a little software in the form of the data reporting portal to be finished, and that seems to be moving along. I received the portal address this afternoon, and should be a little more familiar with it's operation shortly.
7/31/13
Panel Comparisons
Yesterday was my best "solar day" yet with my panels producing 36.27 kWh. We had a nearly cloud free day. The bar chart
shows an almost perfect bell shaped curve, with just a few minor dips due to small clouds quickly passing over.
In
spite of my reservations with
the monitoring software, and the problem module which should be fixed
shortly, I am very well pleased with my system. I am anxious
to
see it put out the maximum power when the Monsoon clouds clear, but
even with the high degree of cloudiness we have been having, I still
have generated what appears to be well over two thirds of my electrical
usage, and July is historically my highest month of power
consumption. I have yet to receive a power bill since the
solar
system
was made operational. It will be interesting.
Since I now have data for a near perfect day of solar generation, I decided to run the numbers. I read the before and after lifetime energy production figures for each panel (a lot of work!), then in a spreadsheet I calculated the average output for each geometry of panels. The results were amazing! If you consider the 4 top south facing panels on the garage, with an 18 degree slope as producing energy at a 100% level, the south facing panels at a 7 degree slope produced 99.0% as much, and the east facing panels produced 98.4% as much. I think this is a very small difference for panels that were not positioned "optimally". Of course these figures are for the end of July when the sun is still very high. It will be interesting to make similar comparisons in the winter. I expect a somewhat wider spread.
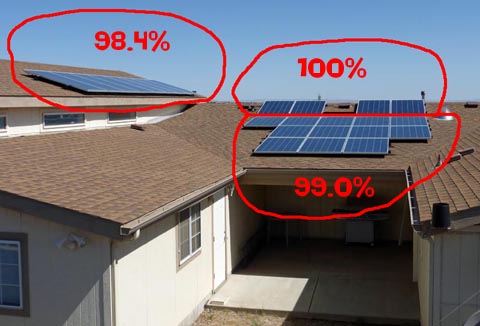
Conventional wisdom says you should mount solar panels pointing south at a slope
of 15 to 30 degrees. My top 4 panels on the garage are the only ones I have meeting
these criteria. This shows how little I lose by using panels mounted outside this range.
Since I now have data for a near perfect day of solar generation, I decided to run the numbers. I read the before and after lifetime energy production figures for each panel (a lot of work!), then in a spreadsheet I calculated the average output for each geometry of panels. The results were amazing! If you consider the 4 top south facing panels on the garage, with an 18 degree slope as producing energy at a 100% level, the south facing panels at a 7 degree slope produced 99.0% as much, and the east facing panels produced 98.4% as much. I think this is a very small difference for panels that were not positioned "optimally". Of course these figures are for the end of July when the sun is still very high. It will be interesting to make similar comparisons in the winter. I expect a somewhat wider spread.
Conventional wisdom says you should mount solar panels pointing south at a slope
of 15 to 30 degrees. My top 4 panels on the garage are the only ones I have meeting
these criteria. This shows how little I lose by using panels mounted outside this range.
Insertion of 1/2/15 More panel comparisons
The comparison of the various panel configurations shown above was taken on 7/30/2013 and involved a lot of individual readings and calculations. I have since streamlined the calculation process considerably by downloading a day's performance data from my data manager into an Excel spreadsheed. This one day file of data includes the output from each panel every 5 minutes for a total of 6912 records. Then by use of a rather complex macro, I can let Excel do all the calculations automatically in a matter of seconds. I ran several more comparisons at various times of the year. As I suspected, my excellent balance was due to the sun being very high in the sky. The difference between the 3 groups of panels was much greater during the winter months. The worst balance I saw was in late December where I had an energy loss of almost 1/3 for the east facing panels. After taking a few samples during the first year, I ran a 1 year average. The 1 day samples below were taken on cloud free days. Of course the yearly sample takes into account the full range of clear, clouds, rain and snow as it happened during the year. I also ran samples just a few days apart in early January, one on a clear day, and the other on a cloudy day. The results of the clear day were slightly better than the ones shown for the end of December, while the ones for the cloudy day showed less than 1% difference for any group, but a much lower total output of course. The clouds obviously diffuse the light so that each panel receives an almost equal amount.
Output Comparisons
of Different Panel Orientations
| Time | South 18 | South 7 | East |
| End of July | Full | -1.0% | -1.6% |
| End of December | Full | -19.7% | -33.2% |
| Full year average | Full | -6.8% | -10.3 |
I noticed that on the summer samples there were times when the "oddball" orientations were even better than the "optimum". All of these imbalances were small. The full year average balance is better than the individual numbers might suggest. This is because the high output summer months out-weigh the much lower output of the winter months and skew the average. Also any cloudy days tend to slightly reduce the spread due to their almost perfect balance.
Taking a weighted average of the efficiencies, my overall yearly loss due to poor panel orientation is 6.83%, compared to having all the panels facing south at an 18 degree elevation. The extra 1.64 panels it takes to make up this loss is less expensive than the mounting hardware it would have taken to mount all the panels optimally, if that were even possible. I think my present configuration is a good compromise.
8/2/13 My Contribution
Today I made my biggest personal contribution (other than writing checks) to the hardware of my solar system. I painted the outside meter and switch boxes. The battleship gray just didn't blend in with my beige colored house. I was fortunate to find a high quality spray paint that very closely matched my outside wall color. It matched better than my left over quantities of the original paint!
| The meter and disconnect switch were not very attractive. Between the battleship gray of the boxes, the many labels, the long screws in the conduit clamps, and the silver colored conduit, I felt I could improve it. | I replaced the long screws in the conduit clamps, removed the box manufacturer's stick on labels and the solar warning labels Pur Solar had installed on these two boxes, and cleaned the areas to be painted. I then thoroughly masked around everything needing painting. It is not pretty, but it protects the surrounding areas. |
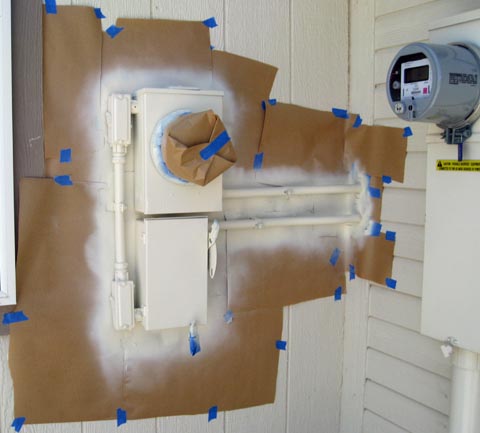
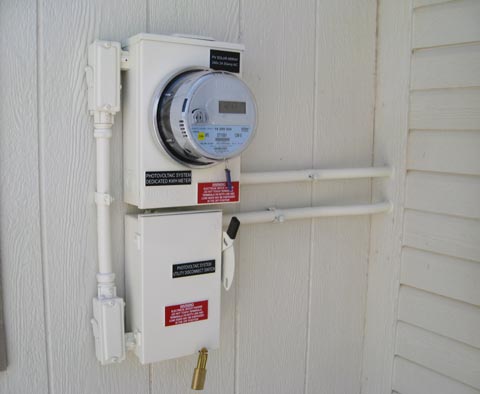
| With
the masking still in place and all the overspray showing, the meters
didn't look all that much better after I finished painting them. |
After removing all the masking, and replacing the solar warning labels they now look far better than before. |
APS gets nasty (greedy)!
Since this project started, APS has made an announcement that they want to eliminate net metering and charge solar users much more money. They quote some ridiculously low numbers as their perceived value of residentially generated power stating it is worth only the bare cost of fuel to generate the power, or about 3.6 cents/kWh. A study commissioned by APS several years ago showed the value to them then at about 14 cents/kWh, well over the then retail price of power. They now say there is no longer any value to them in the infrastructure costs they will avoid, the transmission losses they avoid, the new power plants they avoid having to build, the boost in capacity they receive during heavy demand times, and the renewable energy quotas they must meet. Yet they have no problem delivering this "worthless" power to your next door neighbor and charging full retail price with essentially no other expenses. The solar industry has done a study showing that APS is receiving over double the value of what they pay (or do not get to charge) for our solar power. APS has long been granted status as a monopoly with a guaranteed profit of 10%. They should not be attacking the solar regulations that were established for the greater good of all!
APS has already gone before the Arizona Corporations Commission with their proposal. It will be months before the ACC makes their decision, and then months more before any of the changes are incorporated. I hope they do not accept the distorted numbers APS is feeding them. If net metering is done away with, it will do unbelievable damage to the growing solar industry in Arizona and the efforts to move away from fossil fuels. APS has already succeeded in having the incentives cut way back on commercial solar installations resulting in a decline of about 70% of new commercial solar construction. Currently the solar industry in Arizona employs almost 10,000 workers, or 1 in every 306 so a lot is at stake!
Apparently any changes will not affect my personal situation as I am supposed to now be "grandfathered" in for the next 20 years. At this time I am just not going to worry about how I will feel about it all when I am 96 years old!
8/6/13 Problems Get Fixed!
This morning I received a phone call from a product engineer at Mage. He has been reviewing my "unreported module" situation. He asked if I would be able to access the problem panel. When I told him I could, he asked me to turn off the circuit breakers for the two strings of panels, then cover the problem panel with something light tight for about 15 to 20 seconds. This removes the power from both ends of the micro-inverter (from the AC grid and from the solar panel) and allows a total reset of its electronic circuitry. I found a couple of black trash bags that together would lay flat and cover the entire area of the panel. That didn't work too well! There was enough wind that by the time I taped one end of the bag and moved to tape the second, the wildly flapping bag pulled the first end free. I then searched for an alternate material. I found a roll of thick black plastic about 1/32 inch thick and 18 inches wide I had acquired years ago for a project. I cut 3 lengths and laid them overlapping side by side, and it worked great. The plastic was heavy enough that the wind didn't bother it. The micro-inverter reset and started producing power. We will follow it closely for a couple of weeks to make sure it doesn't fail again. If it does, he already has the paperwork filled out to ship me a new panel. While following up via email, I asked him about one other minor problem, an error notation under the grid profiles for 4 of my panels. He called me again and walked me through re-loading of the profiles, and totally eliminated that problem.
We also discussed some of the features of the new monitoring firmware which is supposed to be released in several weeks to Mage customers. It sounds like it will truly perform all the functions I have found missing with the current firmware. I am thrilled!
8/8/13 My First Bill
This morning my new electric bill showed up on the APS website, covering July 9 to August 7. It is a total of $29.76 for 137 kWh that I did not generate myself! Reviewing all my data, I estimate that I used about 885 total kWh this month which would normally cost around $140. Last year I used about 1100 kWh in July, and it cost $180!
I am thrilled by my first electric bill since activating my solar system!
My previous estimate that I was generating well over 2/3 of my energy was conservative: I generated 84.5% of it! This is wonderful, considering how many days of low output I have had due to cloudiness and other factors. July will always be a difficult month, as it has my highest consumption of the year, however next year I expect to have built up some credit from the previous months to help offset the higher usage.
I no longer have a single point of reference as to how much total electricity I am using. The power company online daily data only show how much APS supplied me, and the monthly bill shows that and how much I supplied APS. They do not account for how much I use directly from the solar panels. To get an accurate figure, I would have to read my solar meter at the same time they record my other readings, so instead, I use the figures my data manager gives me for about the same time period. It should be quite close. I had no idea of just when APS recorded the billing meter readings, but by some detective work, I determined that it is at midnight on the start of the final billing day. So the meter reading for August 7 is taken at the end of the 6th.
Needless to say, I am overjoyed with this bill! For most of this period I have been getting output from only 23 of my 24 panels. For a couple of days after APS installed my new meters, I only had about half my panels working, until I was instructed to do a reset and how to do it. With that and all the cloudiness, I expected much less yield. It should only get better from here!
Insertion of 9/10/13 My Second Bill
This morning I found my second APS bill on-line covering August 7 to September 9. I didn't quite keep up this month either. I generated 52 fewer kWh than I used. My bill was for $20.89. This month I generated about 94.1% of the approximately 884 kWh I used.
Insertion of 10/10/13 My Third Bill (and First Credit Balance!)
No, I'm not going to post each and every bill I get. This should be the last one, unless I post some kind of a summary much later. I just had to post this one, as it is the first month I finished with a CREDIT BALANCE! I generated 184 kWh more than I used this month for a total bill of $13.42. I guess this will be about the amount of my monthly bill any time I have a credit balance. Of course the balance carries forward each month. At the end of the calendar year, if I still have a balance, they will buy my excess electricity from me for slightly less than 3 cents a kWh. So I guess you could say that I earned about $5 in excess electricity this month! Woo Hoo! Actually I probably earned over 3 times that much if it goes to offset times when I don't generate as much as I use. I am paying just under 11 cents a kWh from APS (including taxes) for that electricity. A great thing about my solar is that even if I fail to meet my monthly usage, I am almost assured of my usage being low enough to stay in the first tier of their rate structure for the lowest cost per kWh. Prior to my solar, I was always in the 2nd tier, and occasionally the third and paid much higher costs per kWh.
I like this bill even better than the first two!
This last billing month started out with clouds and I dropped to a credit balance of -40 kWh. Then the rest of the month was pretty clear and I had a credit balance averaging about 7 to 10 kWh each day, leaving an eventual balance of 184. I generated about 127% of my total usage of about 685 kWh. A good month!
As of today, I am within 20 kWh of generating my total usage since the panels were powered up!
Insertion of 10/13/13 Positive lifetime balance
Today my panels met a milestone. I have now generated more energy with my panels than I have used in my household during the total time I have had the panels activated! During the day I went from a -4 kWh lifetime balance in the morning to a +3 balance at the end of the day. The clear weather we have been having looks to continue, with this balance increasing each day.
Insertion of 1/2/15 One Year Summary
I have had the solar system running for about 1 1/2 years now and the performance has been outstanding. I decided to look at my most recent one year period. From 12/8/2013 to 12/8/2014, I generated 702 more kWh than I used, for a total output of 10,473 kWh.. For this period, my yearly electric bill was a total of $175.01. My average yearly bill the 3 previous years was $1265.20 resulting in a direct savings of $1090.19 for this year.
My bill would have been even less, except that APS pays off any positive balance at the final bill of the year, which comes in early December for me. Then as the days are very short at this time of the year I was using more than I generated. My December and January bills were each about $12 or $13 higher than they would have been. By February I was generating excess power again. While it is not a lot of money, it is still frustrating to have them buy my balance at less than 3 cents per kWh and then immediately sell it back to me at about 11 cents. My balance would have easily carried me through my couple of negative balance months.
Even with this minor frustration, the panels have already paid for themselves, even if you only consider that they have added more resale value to my house than I had to pay, and this is with no increase in property tax! My yearly direct savings only improve the bottom line. So far I am on track for a full cash payback in a little over 7 more years (a total of 8.8 years). I am over 1/6 there!
8/17/13 The Meter-cams
Over a period of several weeks I developed and installed a couple versions of what I call my Meter-cams. They constantly view my two electric meters through my security system and let me easily keep a log of my performance.
I installed cameras with night time illumination on both of my electrical
meters. This allows me to easily keep track of the "official" performance
of my system.
Progress and Arrival of the New Software
Things have been progressing smoothly. The "problem panel" apparently had somehow gotten a glitch into it's computer system. The total reset I did on that panel seems to have solved all its problems, and it is still operating perfectly, as are all the other panels.
August started out quite sunny, and I quickly built up a positive energy balance of about 58kWh. The last week or so, the Monsoon clouds have returned and are slowly eating away at my balance for the month. I am well over half way through this billing cycle and still have a small credit balance, but the forecast storms are sure to eliminate that by the end of the weekend. When the skies clear, it will rebuild. It is all a statistical balance.
I received an email from Mage a couple days ago that states I should have the new monitoring software (version 4.0) in the next week. They also included a short video showing some of its functions. It seems to be a much more comprehensive package than what I have now, and truly seems to do everything I find missing in the current version. I can't wait!
Shortly after writing the above paragraphs, I logged onto the portal. It came up with the new software! I am very pleased with what it does and the information it allows me to see.
The new portal software is a major improvement over the old. To see details of both the old and the new versions, you can CLICK HERE FOR SOLAR MONITORING DETAILS
Conclusions
I was into my 5th month of this project before we could turn the switch and start generating power. I certainly was not prepared for it to take anywhere near that long considering the actual installation took about 5 working days, but excessive delays with the city during the permitting process, and with APS delaying their approval process just kept stretching it out. OK, "5th month is a little misleading. The total time duration was about 3 1/4 months when you account for the partial first and last months, but it seemed much longer. There were a couple of "rough edges" initially, which my installer said was "very unusual", but they all got straightened out within about the first month.
The very day APS approved the installation was the first day of heavy Monsoon clouds. They were with us pretty much through the entire month of July. August started off with mostly clear skies with just occasional cloudiness. The heavy clouds and the fact that I use more electricity in July than in any other month have kept me from producing more power than I use, but indications are that that will truly happen. (Inserted 10/24/13:) In fact my 3rd month had a large positive balance, and just into my 4th month, I reached the point where I have generated more power than the total I have used since turning the panels on! I really am pleased with the results so far. As I now have the new monitoring software, which is much, much better than the original, I am (mostly) totally happy!
As you probably have noticed, I am treating this solar installation as much more than just a way of reducing my power bill. It has been a marvelous extension of my hobbies. I am spending much more time than is practical tracking all the numbers, following the trends I see with time, and just trying to find out everything there is to find out about my system. I have been, and am still deriving a lot of pleasure calculating facets of the system that most (sane) people just ignore.
Thanks for persevering with me through all the stages of this endeavor, it has been fun!